The Two Line Elements or TLE format is the standard way to describe satellites in orbit above Earth. Understanding the TLE format allows users to make predictions about future or past satellite passes.
The simplest way to think of a TLE is as a description of an orbiting object’s motion at a specific time known as an epoch. For example, if a user knows what a satellite was and where it was going two days ago, they can predict where it will be using a few calculations. As such, TLEs need to be consistently updated as TLE data over two weeks old becomes unpredictable.
Example TLE
This is an example TLE of the International Space Station. TLE data for most spacecraft can be downloaded from https://www.space-track.org/. Space-Track is a public database maintained by the United States for tracking all orbiting satellites and space junk. This is the latest TLE for the international Space Station:
ISS (ZARYA)
1 25544U 98067A   20331.01187177  .00003392  00000-0  69526-4 0  9990
2 25544  51.6456 267.7478 0001965  82.1336  12.7330 15.49066632257107
Admittedly, the format is a little weird. TLE data was originally designed to fit onto 80 character punch cards. Let’s break down what all these numbers mean.
| Data | Meaning |
| ISS (ZARYA) | The human-readable name. (Optional) |
| Data | Meaning |
| 1 | Line 1 |
| 25544 | Norad ID of the object. |
| U | U=Unclassified. C=Classified. S=Secret. |
| 98067A | International designation ID |
| 20330.68380251 | Epoch time data. 330.68380251th day of 2020. |
| .00003730 | First time derivative of the mean motion. |
| 00000-0 | Second time derivative of the mean motion. |
| 75643-4 | BSTAR drag coefficient. (0.75630) |
| 0 | Ephemeris type (usually zero) |
| 999 | Element set number or serial number. |
| 3 | Checksum (mod 10) |
| Data | Meaning |
| 2 | Line 2. |
| 25544 | Norad ID. |
| 51.6460 | Inclination in degrees. |
| 269.3699 | Right ascension of the ascending node in degrees. |
| 0001910 | Eccentricity of the orbit. (0.00191) |
| 75.3707 | Argument of the perigee in degrees. |
| 348.7711 | Mean anomaly in degrees. |
| 15.49065788 | Mean motion AKA revolutions per day. |
| 25705 | The total revolution count at epoch. |
| 1 | Checksum (mod 10) |
While items like the Norad ID are fairly straightforward, let’s go over a few of the more baffling terms:
- First Time Derivative of the Mean Motion: This is sometimes referred to as the ballistic coefficient. The first time derivative of the mean motion is used for atmospheric drag calculations. It is the daily change in rate of orbits per day due to drag divided by two. Units are in revolutions per day.
- Second Derivative of the Mean Motion: This describes the change over time to the first time derivative of mean motion. In other words, it quantifies much is drag increasing or decreasing over time. This value is usually zero. The value is the second derivative of the mean motion divided by six. The units are revolutions per day cubed.
- BSTAR Drag Coefficient: The BSTAR drag coefficient is just another way of determining atmospheric drag.
- Inclination: The inclination of the orbit. The Earth rotates towards the East. Therefore, an Eastward, equatorial orbit is said to have an zero degree inclination. A satellite launched North in a polar orbit will have around a 90 degree orbit.
- Right Ascension of the Ascending Node: This is sometimes referred to as RAAN. The ascending node of an Earth orbit is where the satellite ascends from below the equator to above it. A RAAN of zero degrees means that that every pass of the ascending node happens over the exact same location on Earth. A RAAN of ten degrees means that the point above Earth where the satellite crosses the ascending node increases by ten degrees to the East every orbit. The Space Station’s ascending node tends to shift Westward on each orbit, so it has a RAAN of almost 270 degrees.
- Eccentricity: This describes how circular an orbit is. An eccentricity of zero is a perfect circle. An eccentricity less than one describes an ellipse. And eccentricity greater than 1 represents a parabola or an object on an escape trajectory.
- Argument of the Perigee: This is the distance between the perigee (closest part of the orbit to Earth) and the ascending node (the point in the orbit where the satellite crosses from the southern hemisphere to the northern hemisphere). It is measured in degrees.
- Mean Anomaly: The mean anomaly specifies how far along the orbit the satellite is in degrees. A mean anomaly of 10 means that the satellite just passed the perigee and is 10/360 or 1/36th of the start of an orbit. A slightly more complicated explanation of the mean anomaly is that we mathematically pretend that the satellite is in a perfectly circular orbit at the distance of the semi-major axis of the orbital ellipse. The mean anomaly represents where the satellite would be in that orbit. The main takeaway though is that it tells how far along in the orbit the satellite at the epoch.
Another page detailing TLE data from NASA can be found here: https://spaceflight.nasa.gov/realdata/sightings/SSapplications/Post/JavaSSOP/SSOP_Help/tle_def.html.

Flag 1
The flag is the full year (1984, 2014, etc…) represented in the following TLE’s epoch timestamp:
HST
1 20580U 90037B   98283.16608533 +.00001737 +00000-0 +17316-3 0  9995
2 20580 028.4683 213.7378 0014507 142.6459 217.5137 14.87014290264551
Flag 2
Use a search engine to find the common name of this satellite based on the Norad ID found in this TLE. For example, if the Norad ID is for the ISS, the answer would be “ISS (Varya)”
1 44352U 19036P   20330.50776687  .00034315  00000-0  48681-3 0  9997
2 44352  28.5338  35.3716 0335253 243.5593 113.0232 15.10229401 78110
Extracting TLE Data With Python
TLE data is fairly useless on its own unless we input it into our software. A popular Python library for space calculations is called Skyfield.
You can visit the Skyfield website and read the documentation here: https://rhodesmill.org/skyfield/.
First, let’s install Skyfield through Python Pip.
# python3 -m pip install skyfield
Now create a new Python file and copy and paste in this code:
#!/usr/bin/env python3

import skyfield.api
import skyfield.elementslib
import sys
import math

# PUT TLE DATA IN THIS STRING!
tle_string = """
ISS (ZARYA)
1 25544U 98067A   20331.01187177  .00003392  00000-0  69526-4 0  9990
2 25544  51.6456 267.7478 0001965  82.1336  12.7330 15.49066632257107
"""

if __name__ == '__main__':
    try:
        tle_lines = tle_string.strip().splitlines()
        if(len(tle_lines) > 2):
            satellite = skyfield.api.EarthSatellite(tle_lines[1], tle_lines[2], tle_lines[0])
        elif(len(tle_lines) == 2):
            satellite = skyfield.api.EarthSatellite(tle_lines[0], tle_lines[1], "UNKNOWN")
        else:
            raise Exception("TLE data needs at least two lines.")
    except Exception as e:
        print("Unable to decode TLE data. Make the sure TLE data is formatted correctly." + e)
        exit(1)
This code will load the TLE data found in the tle_string variable at the top of the file. Save the script as tle.py and run the python file. You should not see any output. If you see errors or warnings, there is likely an issue that needs to be debugged before continuing.
Now, let’s output the TLE data read in by the Skyfield API. Behind the scenes, Skyfield converts degrees to radians among other things, so a few variables need to be converted back into their original form. Open up tle.py and append the following lines of code to print the TLE data.
    classifications = {
        "U": "Unclassified",
        "C": "Classified",
        "S": "Secret"
    }
    classification = classifications.get(satellite.model.classification, "Unknown")

    print("===============================================================================")
    print("Decoded TLE Data")
    print("===============================================================================")

    print(f"Name: {satellite.name}")
    print("")
    print(f"Norad Id: {satellite.model.satnum}")
    print(f"International Classification: {classification}")
    print(f"International Designation: {satellite.model.intldesg}")
    print("Epoch Time (ISO): " + satellite.epoch.utc_iso())

    # Note: Skyfield converts data to SGP4 units, so we need to convert them back.
    xpdotp = 1440.0 / (2.0 * math.pi)
    print(f"First Derivative Mean Motion: {satellite.model.ndot * xpdotp * 1440.0}")
    print(f"Second Derivative Mean Motion: {satellite.model.nddot * xpdotp * 1440.0 * 1440.0}")

    print(f"BSTAR Drag Coefficient: {satellite.model.bstar}")
    print(f"Ephemeris Type: {satellite.model.ephtype}")
    print(f"Element Set Number AKA Serial Number: {satellite.model.elnum}")
    print("")

    # Notes: Skyfield converts degrees to radians, so we need to convert back.
    print(f"Inclination: {math.degrees(satellite.model.inclo)} degrees")
    print(f"Right Ascension of the Ascending Node: {math.degrees(satellite.model.nodeo)} degrees")
    print(f"Eccentricity: {satellite.model.ecco}")
    print(f"Argument of Perigee: {math.degrees(satellite.model.argpo)} degrees")
    print(f"Mean Anomaly: {math.degrees(satellite.model.mo)} degrees")

    # Converting from radians per minute to revolutions per day.
    print(f"Mean Motion: {(satellite.model.no_kozai * 60 * 24) / (2 * math.pi)} revolutions per day")

    print(f"Revolution Number at Epoch: {satellite.model.revnum}")
    print("")
Save tle.py and run it. You should see the following output:
===============================================================================
Decoded TLE Data
===============================================================================
Name: ISS (ZARYA)

Norad Id: 25544
International Classification: Unclassified
International Designation: 98067A
Epoch Time (ISO): 2020-11-26T00:17:06Z
First Derivative Mean Motion: 3.392e-05
Second Derivative Mean Motion: 0.0
BSTAR Drag Coefficient: 6.9526e-05
Ephemeris Type: 0
Element Set Number AKA Serial Number: 999

Inclination: 51.6456 degrees
Right Ascension of the Ascending Node: 267.7478 degrees
Eccentricity: 0.0001965
Argument of Perigee: 82.1336 degrees
Mean Anomaly: 12.733 degrees
Mean Motion: 15.49066632 revolutions per day
Revolution Number at Epoch: 25710
Flag 3
Edit tle_string in tle.py to contain the follow TLE data:
TERRA
1 25994U 99068A   20276.22621794  .00000036  00000-0  18086-4 0  9997
2 25994  98.2061 348.9855 0001436  99.9155 260.2210 14.57112596105865
The flag is the epoch timestamp of the TLE in UTC and ISO format.

Extracting Useful Data
Open tle.py and make sure the TLE string is set back to the International Space Station:
ISS (ZARYA)
1 25544U 98067A   20331.01187177  .00003392  00000-0  69526-4 0  9990
2 25544  51.6456 267.7478 0001965  82.1336  12.7330 15.49066632257107
The data contained in the TLE format is a bit obtuse. Let’s convert the data into something more useful. For example, let’s just output the X, Y, and Z coordinates of the satellite at it’s epoch as well as it’s velocity (dX, dY, and dZ). The letter d stands for delta and it means change in. Append the following lines into tle.py
    print("===============================================================================")
    print("Orbital Position at Epoch in Meters (J2000 State)")
    print("===============================================================================")

    print("Epoch (JSatTrak): " + satellite.epoch.utc_strftime("%d %b %Y %H:%M:%S.%f UTC"))
    print("")

    sat_pos = satellite.at(satellite.epoch)

    print(f"X: {sat_pos.position.m[0]}")
    print(f"Y: {sat_pos.position.m[1]}")
    print(f"Z: {sat_pos.position.m[2]}")

    print(f"dX: {sat_pos.velocity.km_per_s[0] * 1000}")
    print(f"dY: {sat_pos.velocity.km_per_s[1] * 1000}")
    print(f"dZ: {sat_pos.velocity.km_per_s[2] * 1000}")
The at() function gives us the position of the satellite at a given time. The time supplied should be within two weeks of the epoch. Save tle.py and run it. Your output should end like this:
... [Previous Output] ...
===============================================================================
Orbital Position at Epoch in Meters (J2000 State)
===============================================================================
Epoch (JSatTrak): 26 Nov 2020 00:17:05.720930 UTC

X: 4231353.971254317
Y: 392271.71420489077
Z: 5294829.468232902
dX: -68.40548792655996
dY: 7646.679399661274
dZ: -510.21034450259907
That’s much more useful data! We can also get more standard orbital parameters out of the TLE data as well. Append the following code to tle.py:
print("===============================================================================")
    print("Keplarian Elements at Epoch")
    print("===============================================================================")

    print("Epoch (JSatTrak): " + satellite.epoch.utc_strftime("%d %b %Y %H:%M:%S.%f UTC"))
    print("")

    orbit = skyfield.elementslib.osculating_elements_of(sat_pos)

    print(f"Semimajor Axis {orbit.semi_major_axis.m} meters")
    print(f"Eccentricity: {orbit.eccentricity}")
    print(f"Inclination: {orbit.inclination.degrees} degrees")
    print(f"Longitude of Ascending Node: {orbit.longitude_of_ascending_node.degrees}")
    print(f"Argument of Perigee: {orbit.argument_of_periapsis}")
    print(f"Mean Anomaly (Epoch): {orbit.eccentric_anomaly.degrees}")
The osculating elements of the satellite contains all the orbital data about the satellite such as it’s perigee, apogee, and semi-major axis. Save tle.py and run it, this is the full output:
===============================================================================
Decoded TLE Data
===============================================================================
Name: ISS (ZARYA)

Norad Id: 25544
International Classification: Unclassified
International Designation: 98067A
Epoch Time (ISO): 2020-11-26T00:17:06Z
First Derivative Mean Motion: 3.392e-05
Second Derivative Mean Motion: 0.0
BSTAR Drag Coefficient: 6.9526e-05
Ephemeris Type: 0
Element Set Number AKA Serial Number: 999

Inclination: 51.6456 degrees
Right Ascension of the Ascending Node: 267.7478 degrees
Eccentricity: 0.0001965
Argument of Perigee: 82.1336 degrees
Mean Anomaly: 12.733 degrees
Mean Motion: 15.49066632 revolutions per day
Revolution Number at Epoch: 25710

===============================================================================
Orbital Position at Epoch in Meters (J2000 State)
===============================================================================
Epoch (JSatTrak): 26 Nov 2020 00:17:05.720930 UTC

X: 4231353.971254317
Y: 392271.71420489077
Z: 5294829.468232902
dX: -68.40548792655996
dY: 7646.679399661274
dZ: -510.21034450259907
===============================================================================
Keplarian Elements at Epoch
===============================================================================
Epoch (JSatTrak): 26 Nov 2020 00:17:05.720930 UTC

Semimajor Axis 6792209.873715886 meters
Eccentricity: 0.0004711106918294189
Inclination: 51.51171828980169 degrees
Longitude of Ascending Node: 267.4715976364692
Argument of Perigee: 74deg 12' 44.0"
Mean Anomaly (Epoch): 20.6667430934403
For reference, here’s the completed tle.py python file:
#!/usr/bin/env python3

import skyfield.api
import skyfield.elementslib
import sys
import math

# PUT TLE DATA IN THIS STRING!
tle_string = """
ISS (ZARYA)
1 25544U 98067A   20331.01187177  .00003392  00000-0  69526-4 0  9990
2 25544  51.6456 267.7478 0001965  82.1336  12.7330 15.49066632257107
"""

if __name__ == '__main__':
    try:
        tle_lines = tle_string.strip().splitlines()
        if(len(tle_lines) > 2):
            satellite = skyfield.api.EarthSatellite(tle_lines[1], tle_lines[2], tle_lines[0])
        elif(len(tle_lines) == 2):
            satellite = skyfield.api.EarthSatellite(tle_lines[0], tle_lines[1], "UNKNOWN")
        else:
            raise Exception("TLE data needs at least two lines.")
    except Exception as e:
        print("Unable to decode TLE data. Make the sure TLE data is formatted correctly." + e)
        exit(1)

    classifications = {
        "U": "Unclassified",
        "C": "Classified",
        "S": "Secret"
    }
    classification = classifications.get(satellite.model.classification, "Unknown")

    print("===============================================================================")
    print("Decoded TLE Data")
    print("===============================================================================")

    print(f"Name: {satellite.name}")
    print("")
    print(f"Norad Id: {satellite.model.satnum}")
    print(f"International Classification: {classification}")
    print(f"International Designation: {satellite.model.intldesg}")
    print("Epoch Time (ISO): " + satellite.epoch.utc_iso())

    # Note: Skyfield converts data to SGP4 units, so we need to convert them back.
    xpdotp = 1440.0 / (2.0 * math.pi)
    print(f"First Derivative Mean Motion: {satellite.model.ndot * xpdotp * 1440.0}")
    print(f"Second Derivative Mean Motion: {satellite.model.nddot * xpdotp * 1440.0 * 1440.0}")

    print(f"BSTAR Drag Coefficient: {satellite.model.bstar}")
    print(f"Ephemeris Type: {satellite.model.ephtype}")
    print(f"Element Set Number AKA Serial Number: {satellite.model.elnum}")
    print("")

    # Notes: Skyfield converts degrees to radians, so we need to convert back.
    print(f"Inclination: {math.degrees(satellite.model.inclo)} degrees")
    print(f"Right Ascension of the Ascending Node: {math.degrees(satellite.model.nodeo)} degrees")
    print(f"Eccentricity: {satellite.model.ecco}")
    print(f"Argument of Perigee: {math.degrees(satellite.model.argpo)} degrees")
    print(f"Mean Anomaly: {math.degrees(satellite.model.mo)} degrees")

    # Converting from radians per minute to revolutions per day.
    print(f"Mean Motion: {(satellite.model.no_kozai * 60 * 24) / (2 * math.pi)} revolutions per day")

    print(f"Revolution Number at Epoch: {satellite.model.revnum}")
    print("")

    print("===============================================================================")
    print("Orbital Position at Epoch in Meters (J2000 State)")
    print("===============================================================================")

    print("Epoch (JSatTrak): " + satellite.epoch.utc_strftime("%d %b %Y %H:%M:%S.%f UTC"))
    print("")

    sat_pos = satellite.at(satellite.epoch)

    print(f"X: {sat_pos.position.m[0]}")
    print(f"Y: {sat_pos.position.m[1]}")
    print(f"Z: {sat_pos.position.m[2]}")

    print(f"dX: {sat_pos.velocity.km_per_s[0] * 1000}")
    print(f"dY: {sat_pos.velocity.km_per_s[1] * 1000}")
    print(f"dZ: {sat_pos.velocity.km_per_s[2] * 1000}")

    print("===============================================================================")
    print("Keplarian Elements at Epoch")
    print("===============================================================================")

    print("Epoch (JSatTrak): " + satellite.epoch.utc_strftime("%d %b %Y %H:%M:%S.%f UTC"))
    print("")

    orbit = skyfield.elementslib.osculating_elements_of(sat_pos)

    print(f"Semimajor Axis {orbit.semi_major_axis.m} meters")
    print(f"Eccentricity: {orbit.eccentricity}")
    print(f"Inclination: {orbit.inclination.degrees} degrees")
    print(f"Longitude of Ascending Node: {orbit.longitude_of_ascending_node.degrees}")
    print(f"Argument of Perigee: {orbit.argument_of_periapsis}")
    print(f"Mean Anomaly (Epoch): {orbit.eccentric_anomaly.degrees}")
Importing This Data into JSatTrak
Download JSatTrak from the JSatTrak homepage.
JSatTrak Homepage: https://www.gano.name/shawn/JSatTrak/
For Windows and MacOS, you should be able to just run the executable for your system assuming you have Java installed. Mac users should use Apple’s Java distribution. Unix and Linux users will have to download .so files for your system and put them in the same folder as the jar file.
For Unix / Linux users:
- Download the JOGL file for your architecture from https://jogamp.org/deployment/archive/master/jogl-old-1.1.1/
- Download the gluegen file for your architecture from https://jogamp.org/deployment/archive/master/gluegen-old-1.0b6/
- Unzip the files “jogl-natives-linux-.jar” and “gluegen-rt-natives-linux-.jar”
- Move the following files to the JSatTrack main folder: libjogl_awt.so, libjogl_cg.so, libjogl.so, libgluegen-rt.so
- Run JSatTrak by executing “java -jar JSatTrak.jar” In the JSatTrak directory.
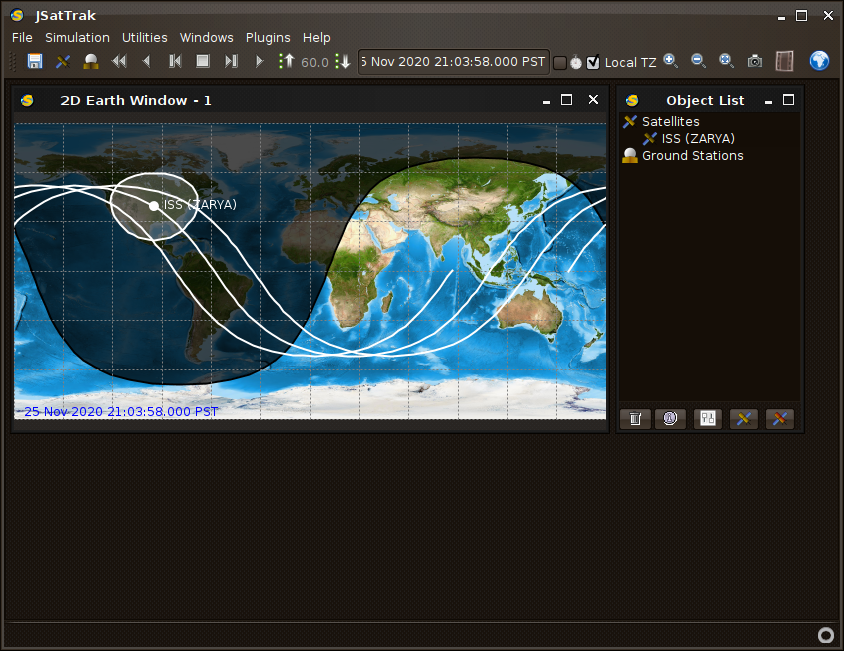
After starting JSatTrak, you should be greeted with a window that looks like this:
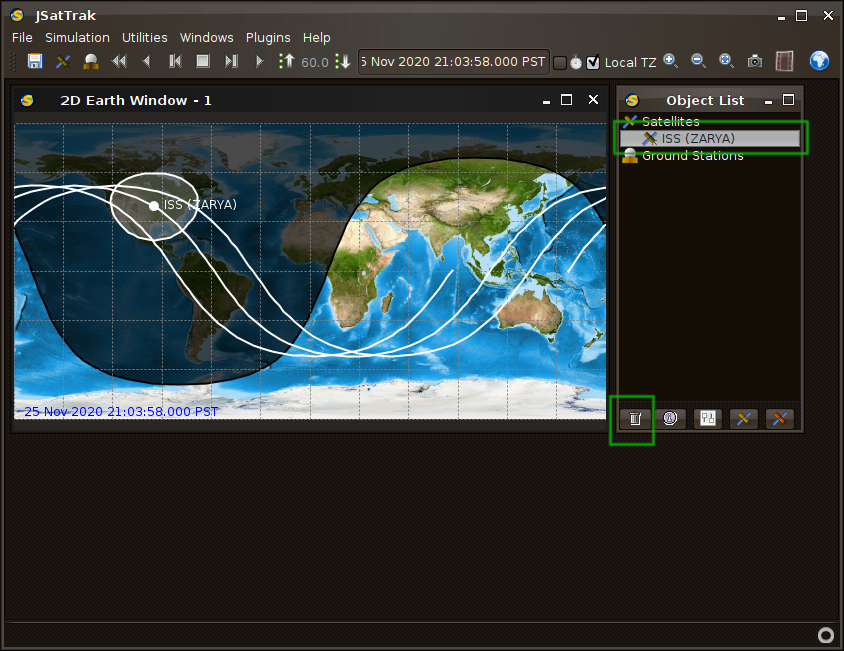
First, let’s stop automatically tracking the ISS. Click on the “ISS (ZARYA)” icon in the “Objects List” window, then click on the trash can icon at the bottom of the “Object List” window.
Now click the “Add Custom Satellite” button at the bottom of the “Object List” window

You will be greeted with a Window to name the custom satellite. Name it “Custom ISS”. Press OK.

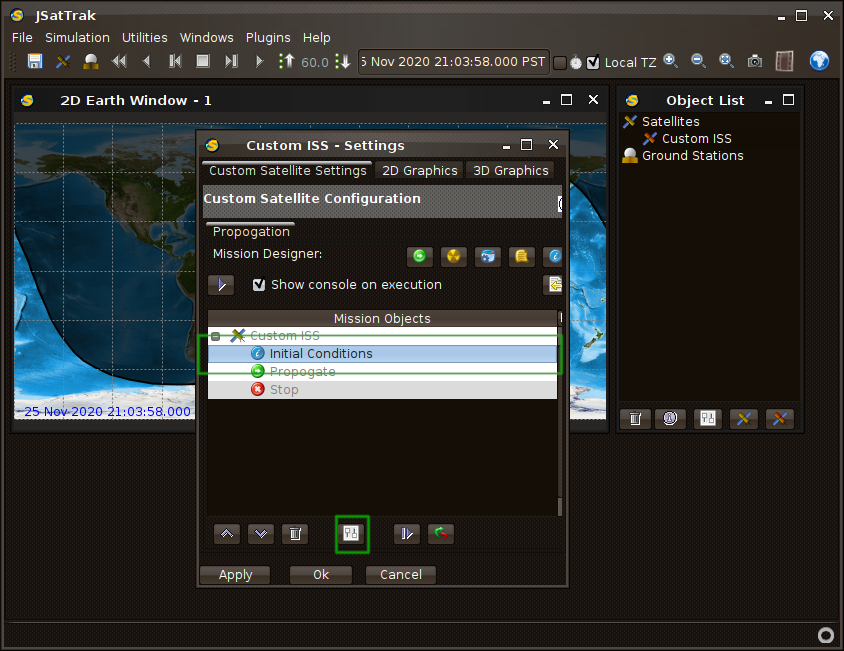
Now you will see a settings window for our custom satellite. Click on the “Initial Conditions” node then click on the “Display Selected Node’s Settings” button.
In the “Initial Conditions” window, select the Input Type to be “J2000.0 State”.

Set the X, Y, Z, dX, dY, dZ, and Epoch inputs to the output we got from the tle.py Python program. As a reminder, here is the output again:
===============================================================================
Orbital Position at Epoch in Meters (J2000 State)
===============================================================================
Epoch (JSatTrak): 26 Nov 2020 00:17:05.720930 UTC

X: 4231353.971254317
Y: 392271.71420489077
Z: 5294829.468232902
dX: -68.40548792655996
dY: 7646.679399661274
dZ: -510.21034450259907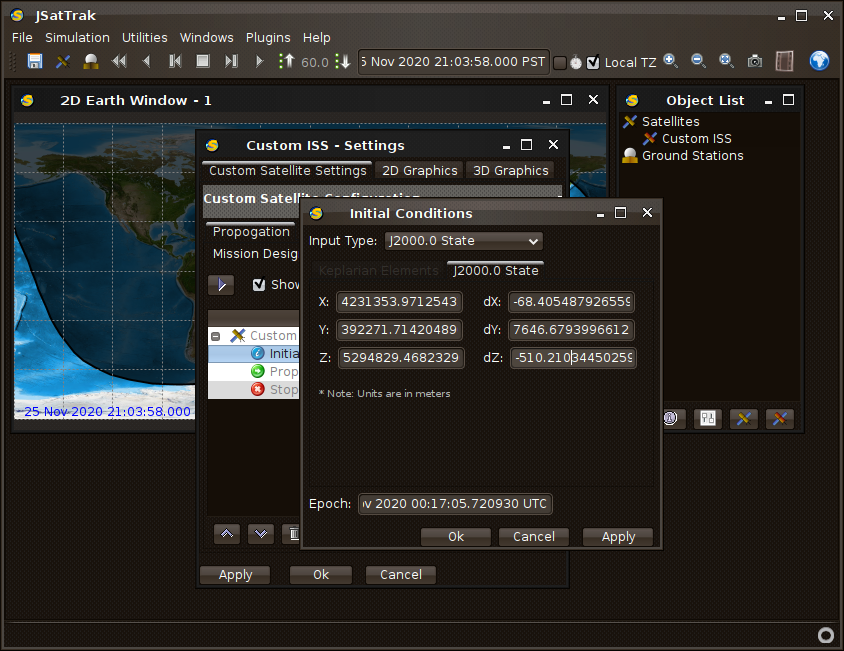
Push the OK button in the Initial Conditions window once all the values have been copy and pasted in. Back in the “Custom ISS – Settings” window, push the Propogate Mission button.
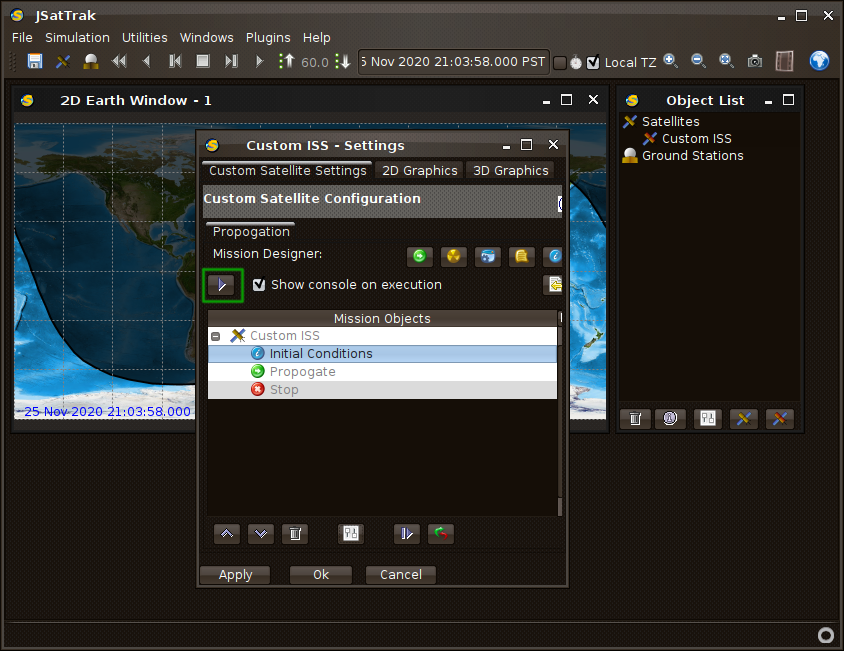
A console / log window will open while it does the calculations. You can close it. Push the OK button at the bottom of the “Custom ISS – Settings” window to close it.
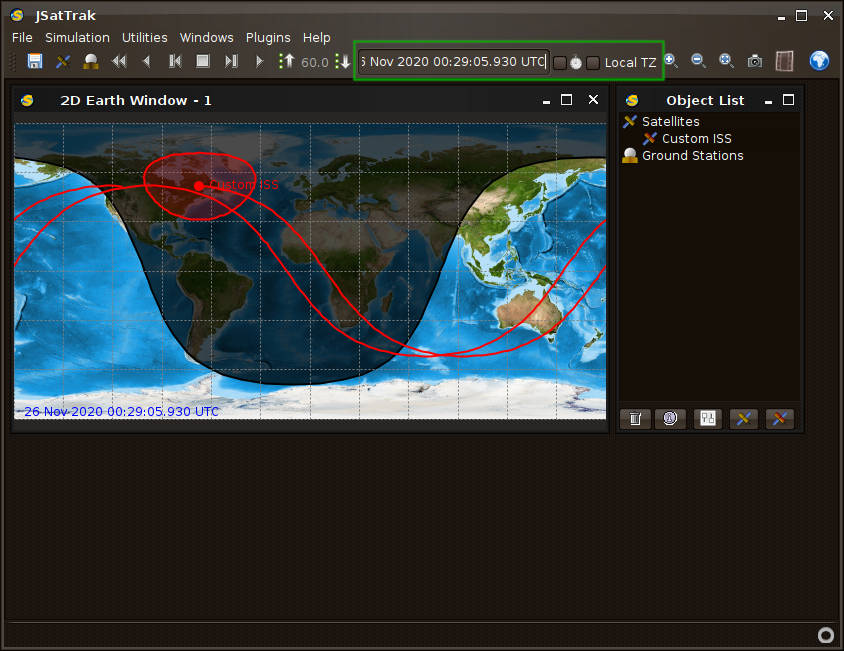
Back in the main window, set the tracking time to this TLE’s epoch time:
26 Nov 2020 00:17:05.720930 UTCMake sure “Local TZ” is unchecked as as are using UTC. Now we can see that the epoch for the ISS was updated as it was flying near the East coast of North America.
Flag 4
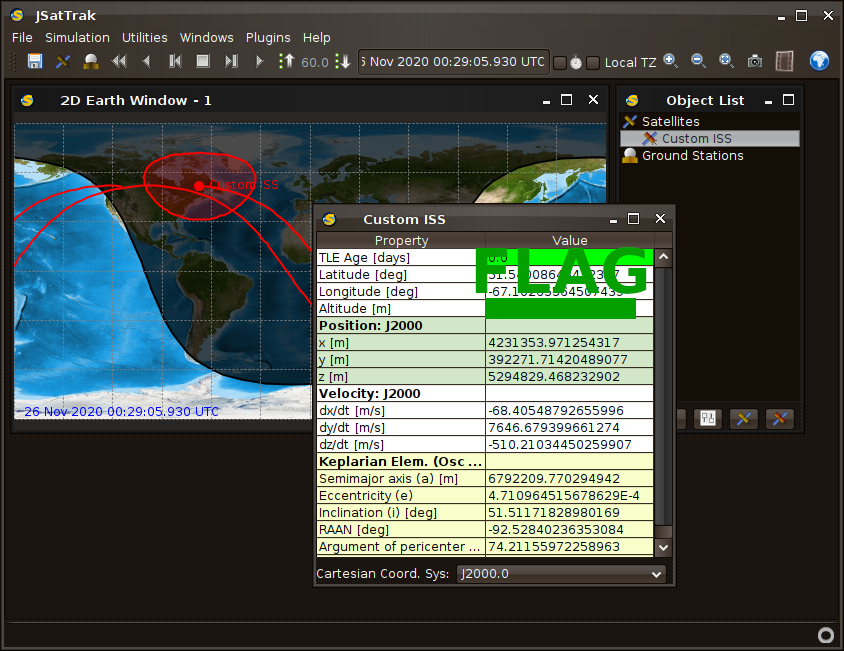
In the “Object List” window, click on “Custom ISS” then click on the “Object Information” button at the bottom of the “Object List” window.

The flag is the altitude at the TLE’s epoch rounded down to the nearest whole number. For example, if the altitude is “42924.829492”, the flag would be “42924”
Flag 5
Using the Python program, tle.py, and JSatTrak, the flag is the name of the country NOAA 19 flew over at 06 Nov 2018 13:20:30.000 UTC, using the following TLE data:
NOAA 19
1 33591U 09005A   18310.53956013  .00000041  00000-0  47514-4 0  9990
2 33591  99.1587 291.5042 0013062 289.1285  70.8471 14.12316492502267